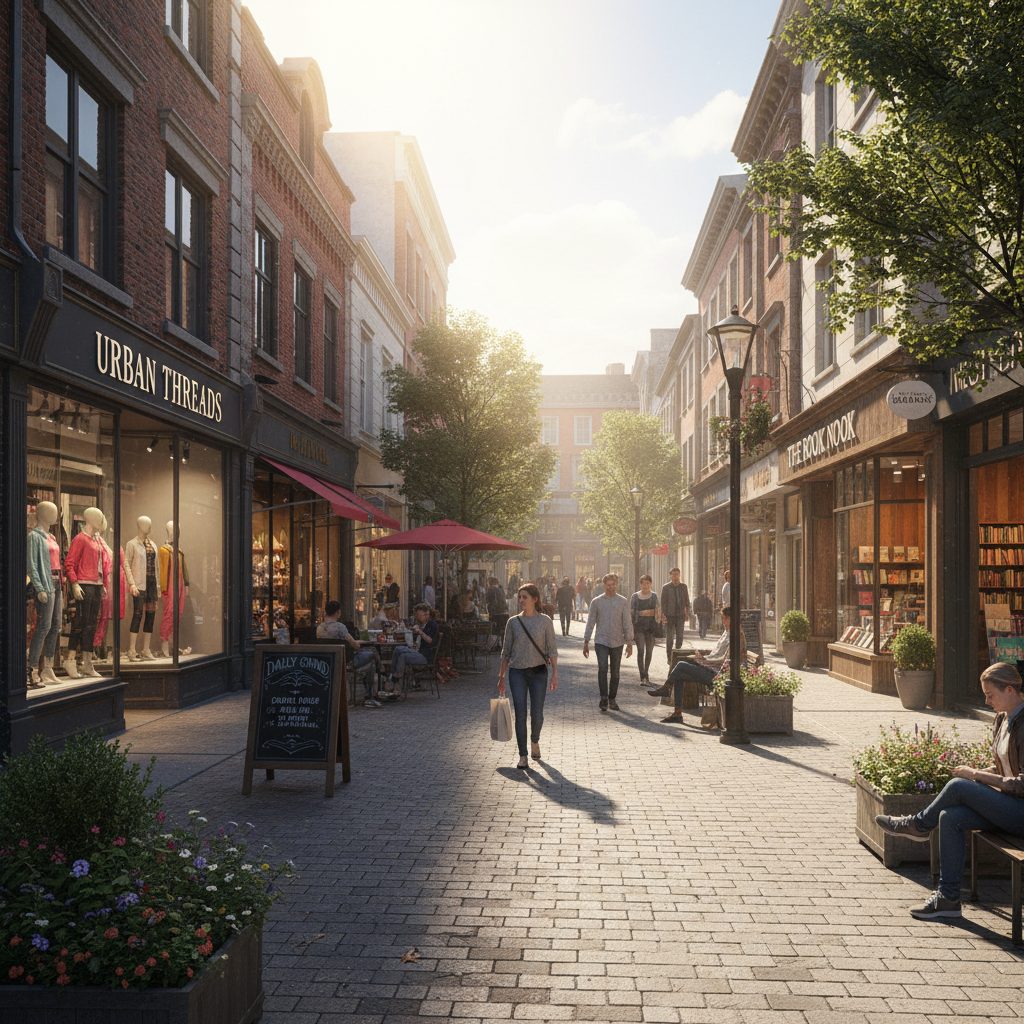
We see what
the market
walks past.
Foot traffic geometry. Anchor tenant gravity. Lease structure arbitrage. We read city blocks to place capital exactly where retail still thrives.
0+
Assets Evaluated
0.0x
Avg Equity Multiple
$0.0B
Capital Influenced
0%
Occupancy at Exit
0 mo
Avg Time to Reposition
Portfolio Elevations
Before the market repriced.
We had already read the block.
Strip Center · 48,000 SF
Westlake Strip Center — Austin, TX
Identified 14 months before the grocer signed LOI.
Anchor vacancy at 34%. Three national tenants on below-market leases with co-tenancy kick-out clauses. Pedestrian volume: 2,100/day.
Grocer-anchored with two fitness tenants and a medical office pad. Leases repriced 22% above market. Pedestrian volume: 8,400/day.
IRR
23.4%
Unlevered
NOI Growth
+61%
36-month hold
Cap Rate Δ
−85bps
At exit
High Street · 12,200 SF
Harbor Row Corridor — Baltimore, MD
Co-tenancy risk eliminated before any capital was deployed.

Family office holding with three month-to-month tenants and one dark anchor. Effective GLA utilized: 58%. Last appraised in 2019.
F&B-led lineup with a regional grocery concept and two service tenants. 100% occupancy. NNN lease structures throughout.
Value Uplift
+$4.2M
On $6.8M basis
Occupancy
100%
NNN leases
Timeline
11 mo
Lease-up